¶ Software Introduction
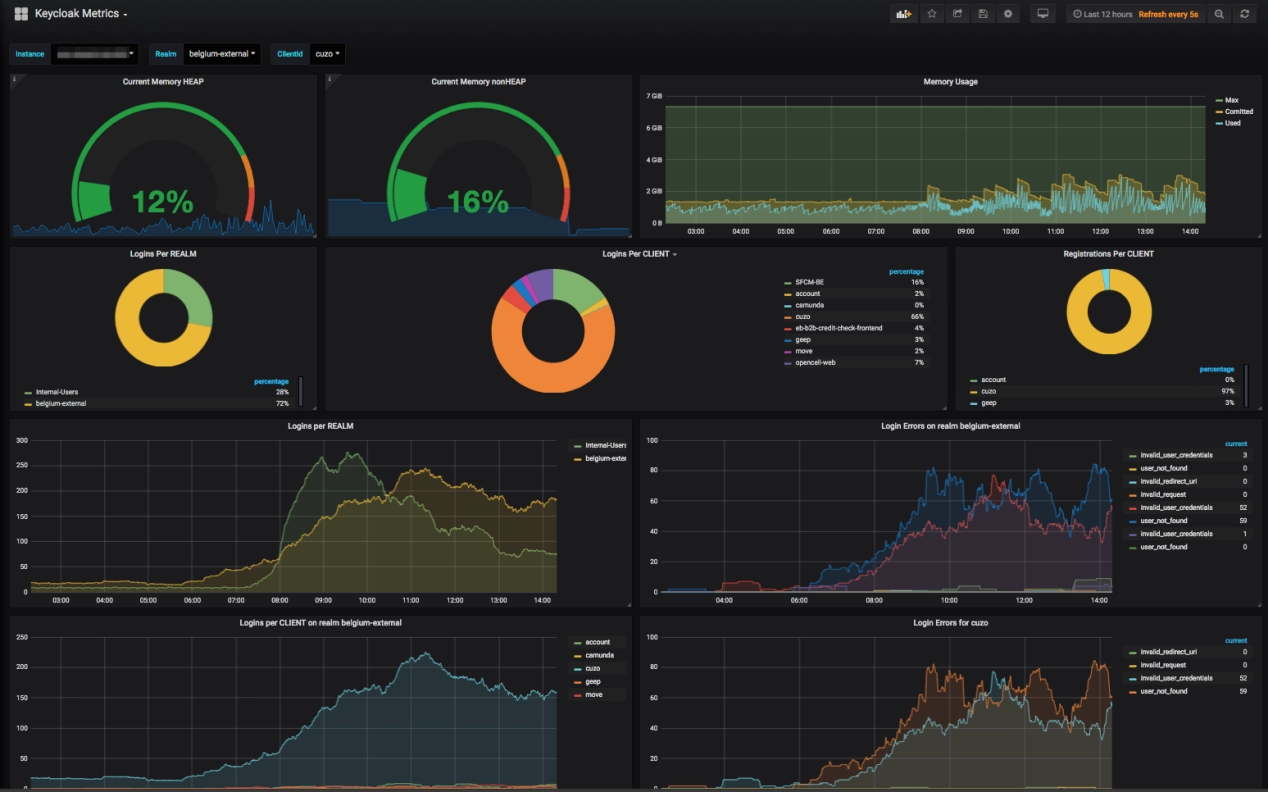
Grafana is an open-source observability and analytics platform designed for large-scale monitoring and data visualization. It can display data through various visual dashboards, but it does not handle the data layer itself. Instead, it provides universal interfaces and relies on data from various sources. It seamlessly integrates with multiple databases, time-series databases, and cloud service data sources, transforming complex metric data into intuitive graphs, charts, and alerts through powerful dashboards. Whether for infrastructure monitoring, application performance analysis, or business data insights, Grafana offers a unified interface to help users gain real-time awareness of system status.
Currently, some COEX devices have integrated the Grafana platform based on the Prometheus database. This document primarily introduces how to use Grafana to monitor various metrics of COEX controllers.
Controller firmware: MX30 Custom Firmware MX30 V1.5.0.B0.CTM1000
- Install and run VMP V1.5.0 software.
- Find “Tools” in VMP software, select “Maintain”.
- Select “Upgrade”, upload the firmware file, then upgrade the controller.
¶ Configuration Process
The process of monitoring COEX device status using the dashboard is as follows. Each step will be explained in detail later.
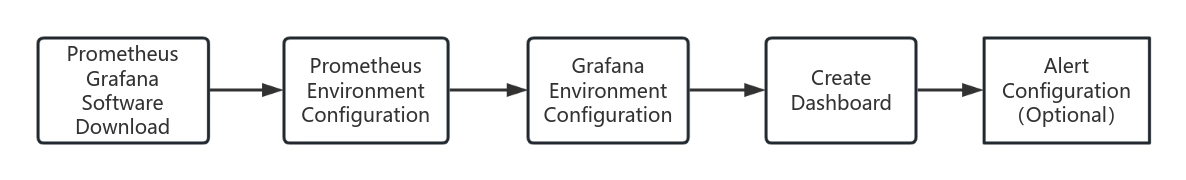
After installing Grafana and Prometheus, it is necessary to configure Prometheus to collect COEX device data and configure Grafana to retrieve information from the Prometheus database. Once configured, users can create dashboards to monitor COEX device information. Regarding dashboard alerts, they are designed to notify users when a specific metric exceeds the predefined threshold. Alert notifications can be delivered via platforms such as email. The configuration of alerts can be enabled or disabled based on user requirements.
¶ Software download
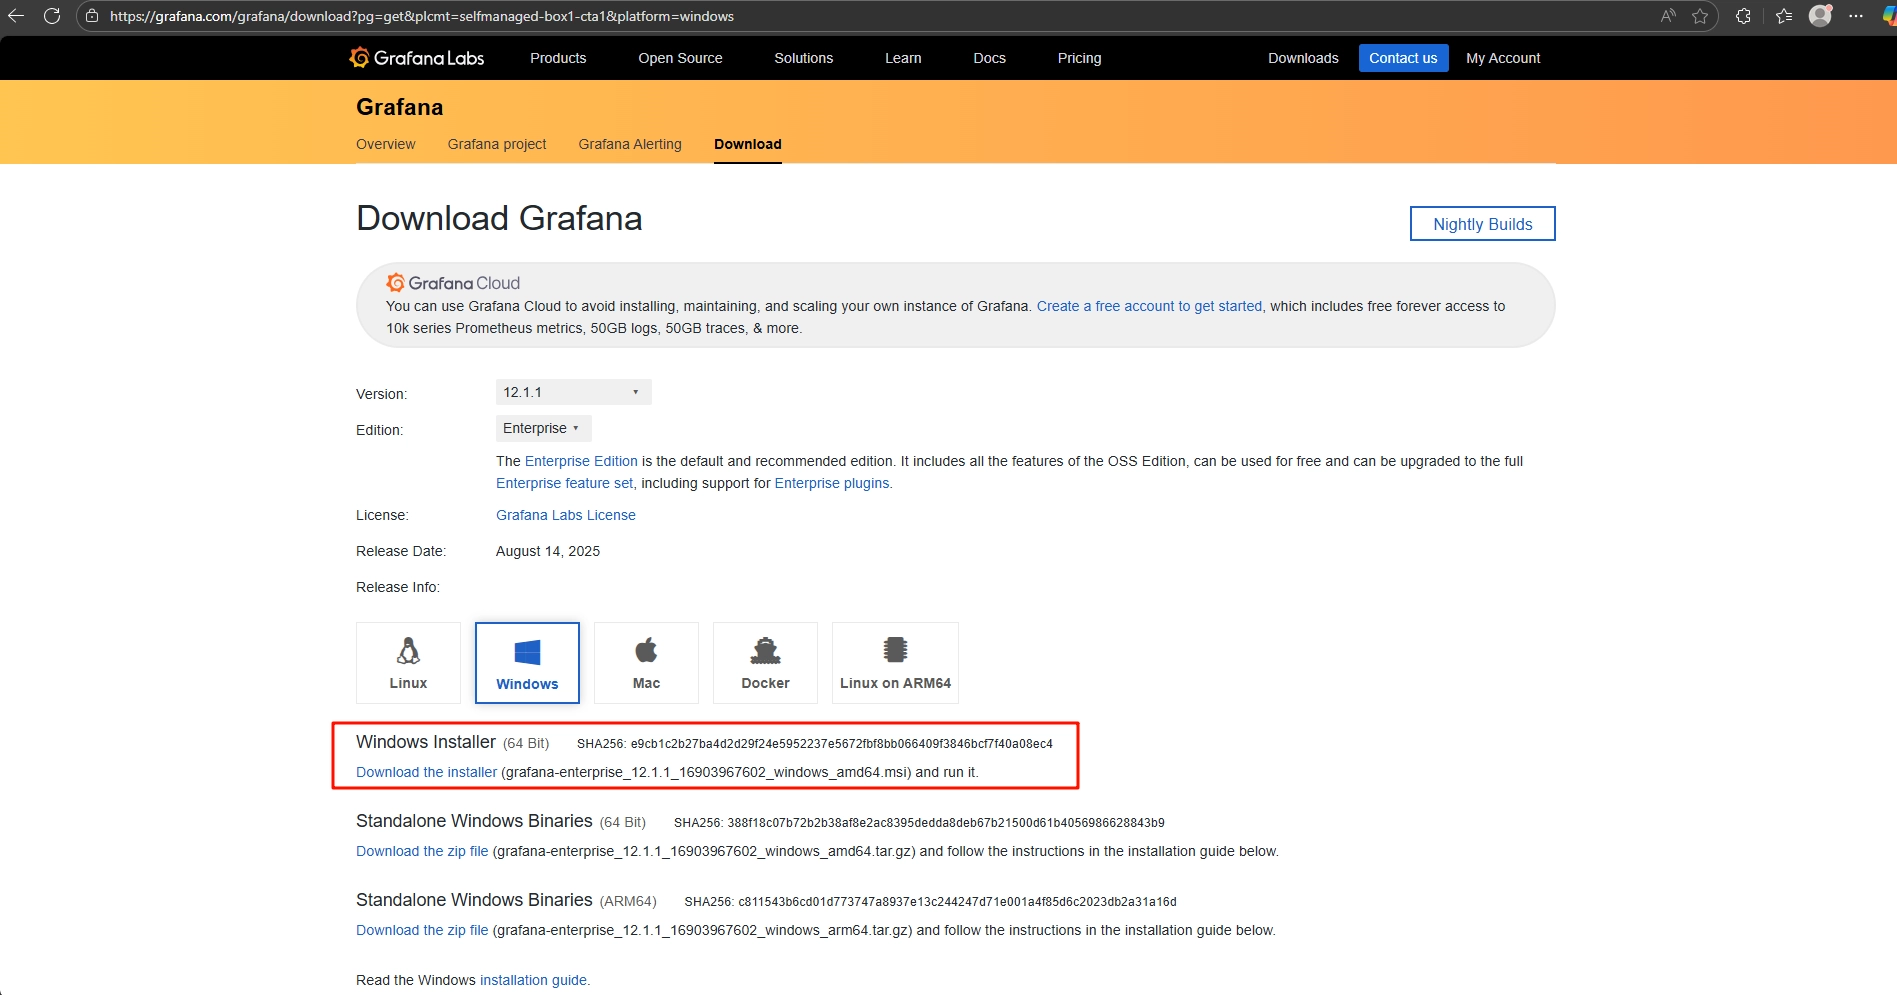
Download and install Grafana, selecting the correct installation package based on your computer's operating system.
Grafana download website: Download Grafana | Grafana Labs
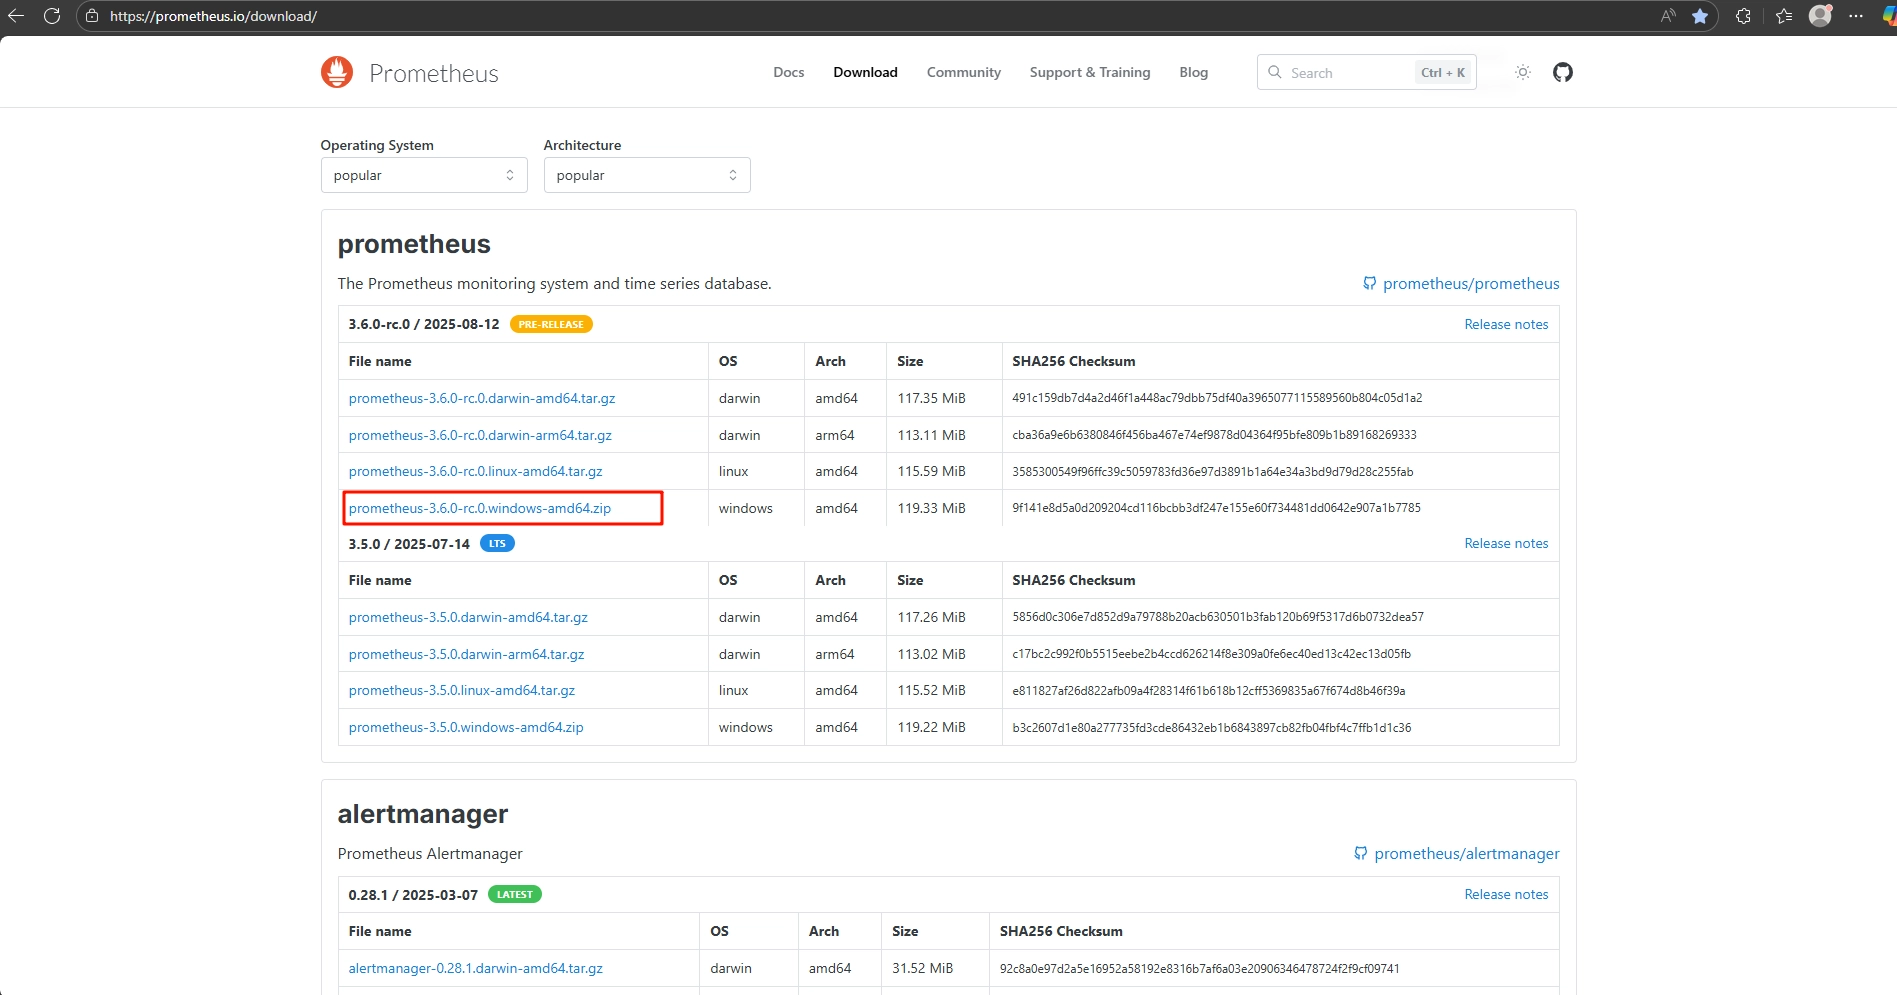
Download and install Prometheus, selecting the correct installation package based on your computer's operating system.
Prometheus download website: Download | Prometheus
¶ Prometheus Environment Configuration
Locate the prometheus.yml file in the Prometheus installation directory, open it, and add the following content:
- job_name: "coex"
# metrics_path defaults to '/metrics'
# scheme defaults to 'http'.
static_configs:
- targets: ["192.168.0.10:9080"]
# The label name is added as a label `label_name=<label_value>` to any timeseries scraped from this config.
labels:
app: "mx30"
Save the changes and run the prometheus.exe program.
¶ Grafana Environment Configuration
First, navigate to the Grafana installation path and run \bin\grafana-server.exe. After the service is running, open a browser and enter http://localhost:3000. Press Enter, and you will see the Grafana login interface.
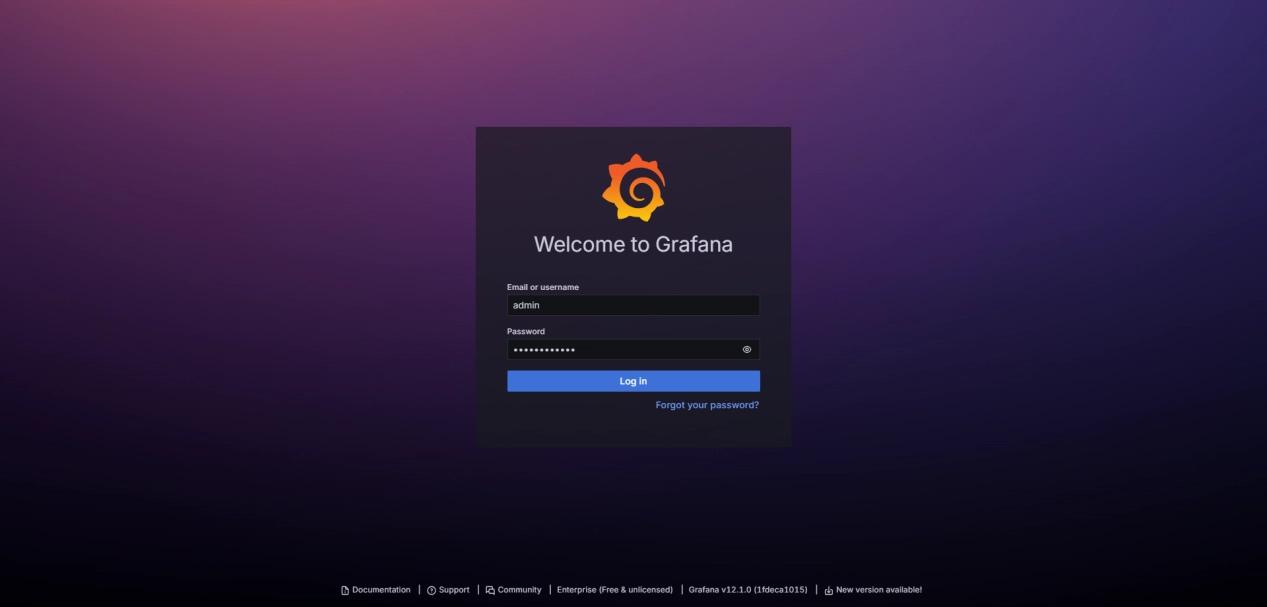
The default username is admin, and the password is also admin. After logging in, the system will prompt you to change the password. Once the password is updated, you will be able to access the main interface of Grafana.
Select Data sources from the left menu bar to configure the data source. Click Add source, then set the data source URL to http://localhost:9090 and save the configuration. If Successfully queried the Prometheus API appears when clicking Save & Test, it indicates that Grafana and Prometheus have established data connectivity. Otherwise, check whether the above configurations are correct.
¶ Create Dashboards
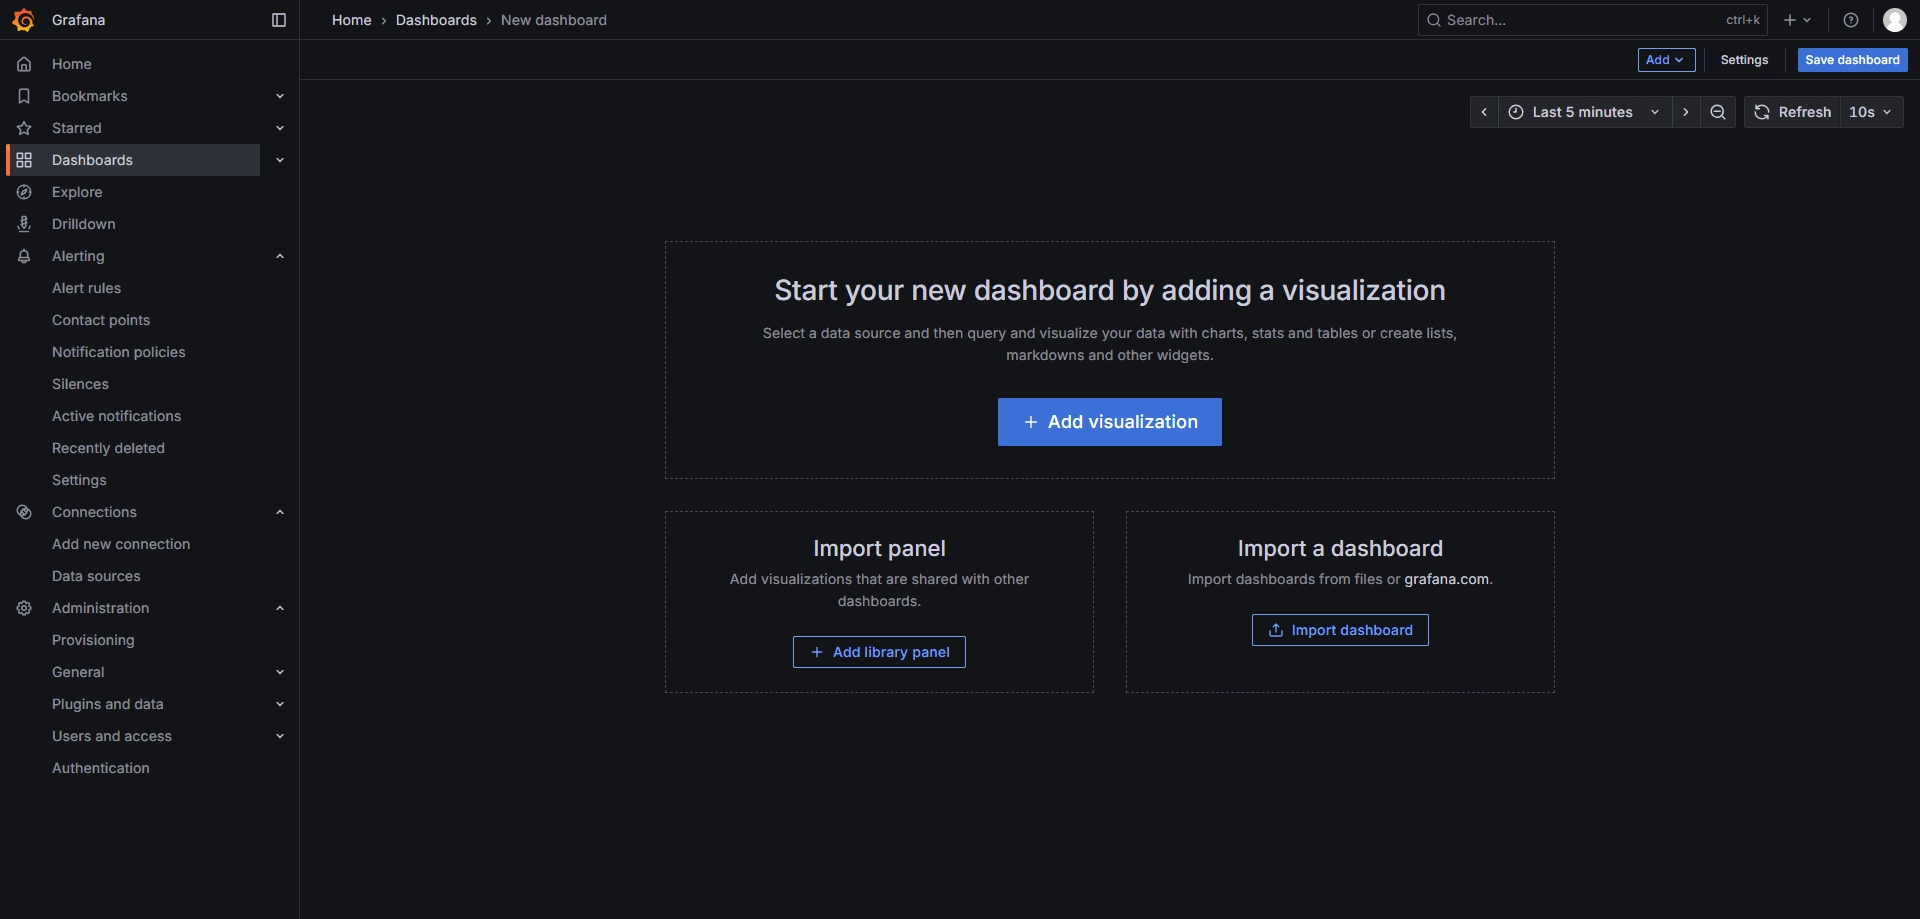
Create a new dashboard in the Dashboards panel.
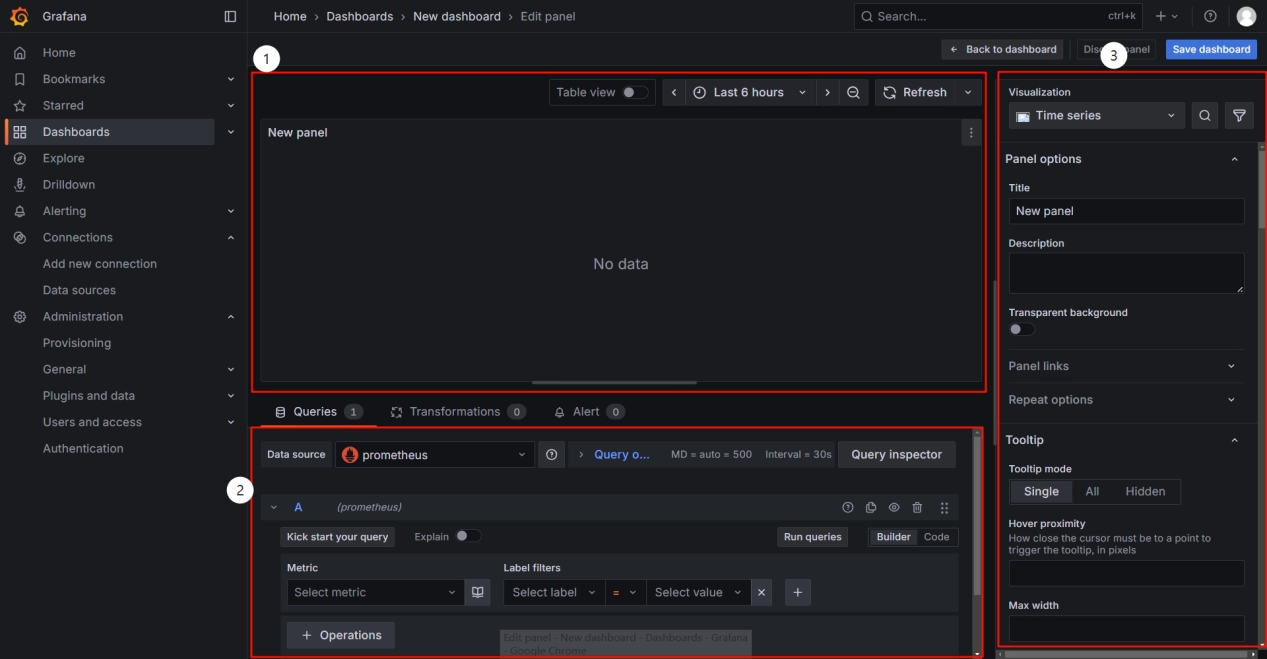
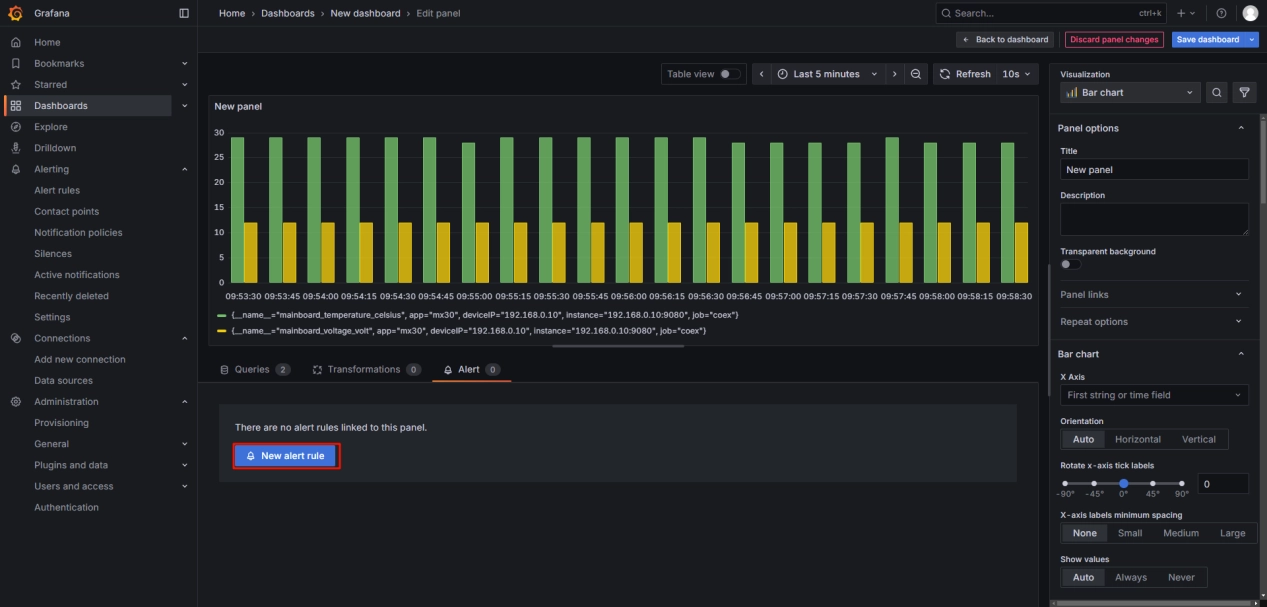
The following image shows the dashboard editing interface. Area 1 is the dashboard display section, where you can set the time range and auto-refresh interval. Area 2 is used to input data for generating the dashboard. You can use either the Code mode or the Builder mode. There is no fundamental difference between the two modes. The builder mode allows you to directly select parameters such as Metric and Label filters from dropdown menus, while the code mode requires manually entering complete code statements. Area 3 is the dashboard editing section, where you can configure the chart type, title, data units, colors, and other settings. This area is primarily used to modify the visual presentation of the dashboard.
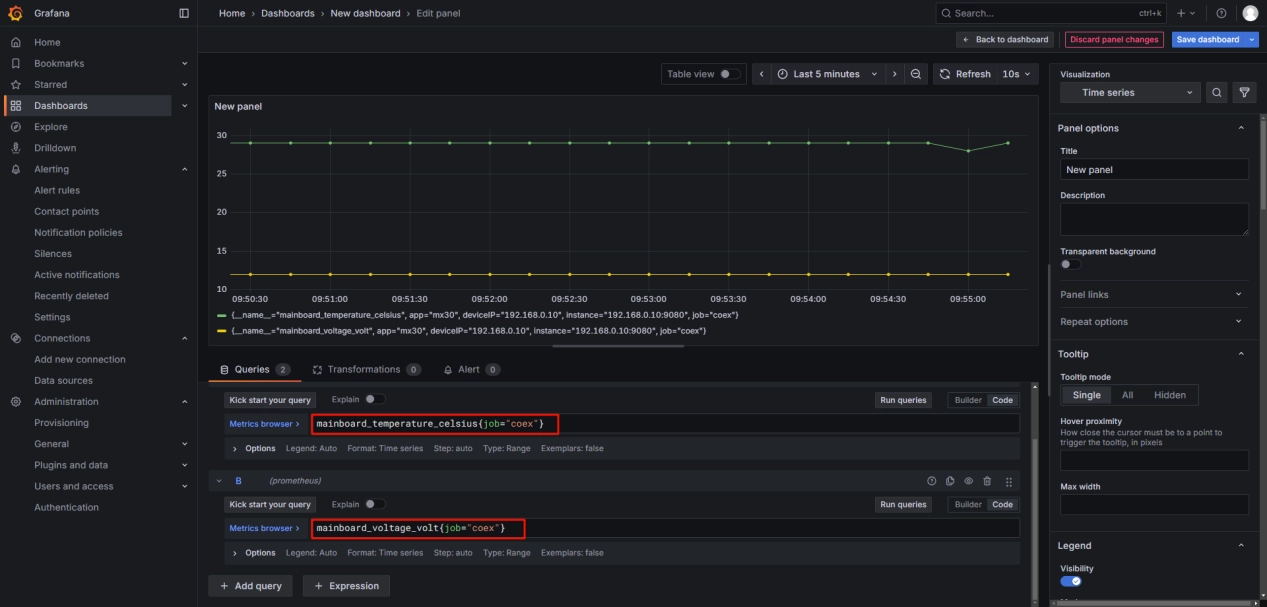
For example, to create a dashboard for monitoring the device's temperature and voltage:
Use the Builder mode, select mainboard_temperature_celsius and mainboard_voltage_volt as Metrics, and set the filter to limit the device scope with job=coex. Then click Run queries to generate the dashboard. Adjust the time range to display the past 5 minutes and set the auto-refresh interval to 10 seconds as needed.
The parameters selected above will automatically generate a string of code. Entering this code in the code mode will produce the same dashboard.
On the right side, under Visualization, you can choose from various types of charts and modify other details such as titles, grid lines, units, and more.
¶ Alert Configuration
Grafana allows users to configure alert rules, notification methods, and alert content for dashboards to promptly monitor and notify system anomalies. Under the Alert section at the bottom of the dashboard, create alert rules.
Name: Configure the alert name.
Define query and alert condition: Specify which dashboard the alert rule is added for.
Alert condition: Set the trigger condition and threshold value for the alert.
Add folder and labels: Manage alert rules by creating folders and adding labels.
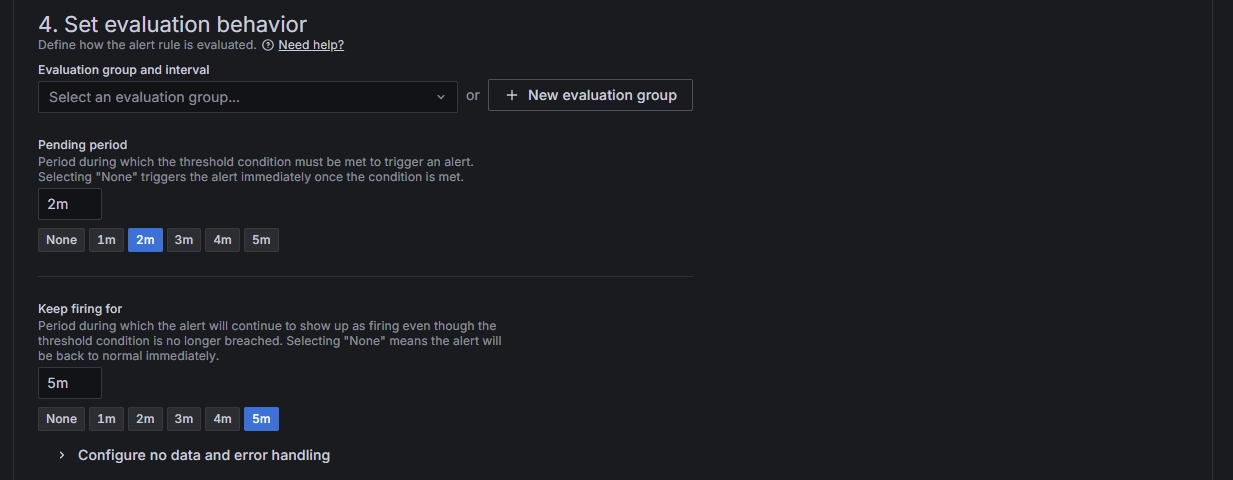
Set evaluation behavior: Configure the frequency of checks. For example, the settings below indicate checking every 2 minutes whether the alert condition is met. The alert will be officially triggered and sent to the configured notification channels only if the condition persists for 5 consecutive minutes.
Configure notifications: Set up alert notification methods, such as sending alert content via email, WeChat, etc.
Configure notification message: Customize the alert content, either using the default template or a user-defined one.
¶ Dashboard Import and Export
In Grafana, configured dashboards are stored as JSON files. This means that if you share the JSON file of a pre-configured dashboard with others, they can import it and directly use the same dashboard.
To save the dashboard configuration, you can export the JSON file or copy the JSON code via the Export option in the upper-right corner.
In the Dashboards directory or within an already created dashboard, you can import a JSON file to directly generate a dashboard. Note that dashboard names must be unique. Each dashboard has a unique UID, and importing a duplicate name will overwrite the existing dashboard.
Additionally, the official Grafana website features a dashboard marketplace where a wide variety of pre-built dashboards are available. These dashboards can be used to monitor many standardized services, such as Nginx, Kubernetes, MongoDB, computer CPU and memory usage, and more.
Grafana marketplace website: Grafana dashboards | Grafana Labs
We consistently enhance and refine the content of our Wiki articles.
If you find any mistakes or errors, please contact us.
Your continuous feedback and support will help us further improve our products and content.