In V1.4.0 and previous versions, the monitoring capabilities were primarily focused on displaying controller-related information and operational status. However, the scope of monitorable status data was relatively limited, including only metrics such as receiving card temperature, chassis voltage, and cumulative bit errors.
Additionally, the monitoring and handling of system exception logs in earlier versions were rudimentary, supporting only basic functionalities like categorization, search, query, and import/export of logs.
In the latest Version 1.5.0, when paired with specific cabinets, you can now monitor new parameters. Additionally, we have implemented comprehensive improvements to the monitoring functionality, enhancing its performance, accuracy, and user experience.
In this VMP demonstration page, we will introduce the Monitor Interface in VMP V1.5.0.
¶ System Health Monitoring

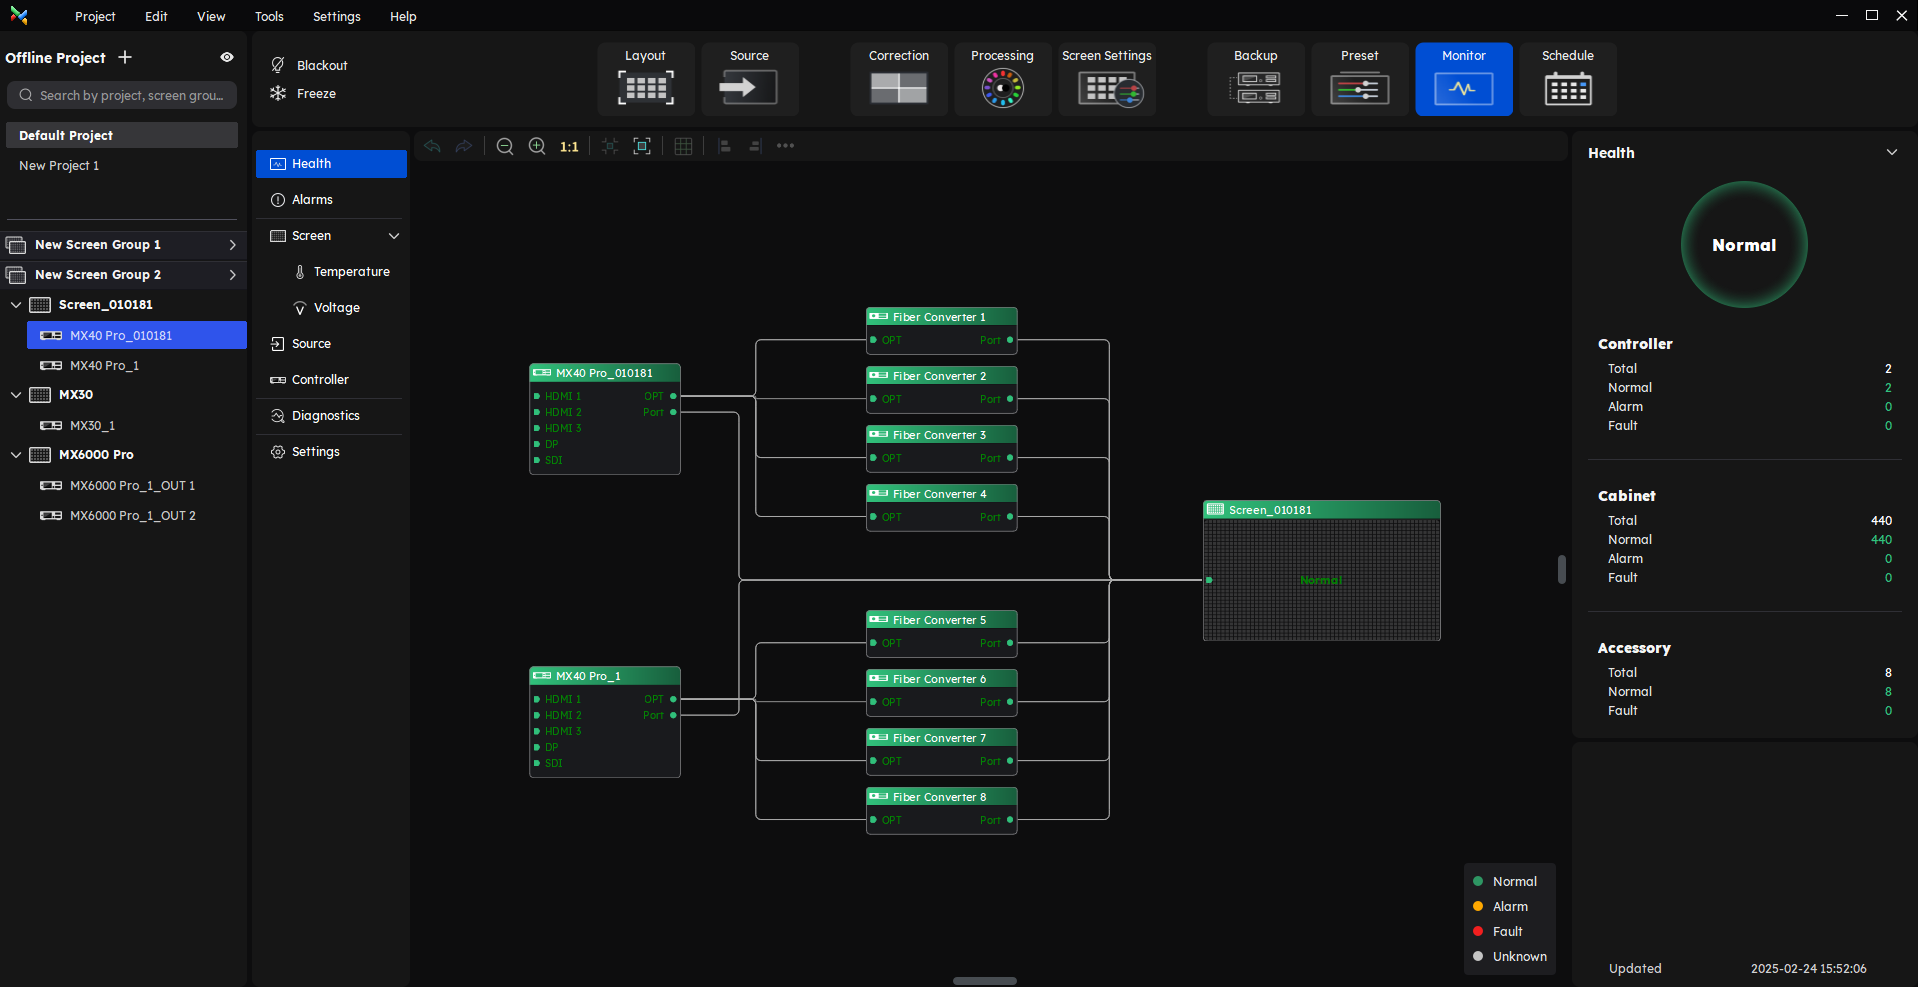
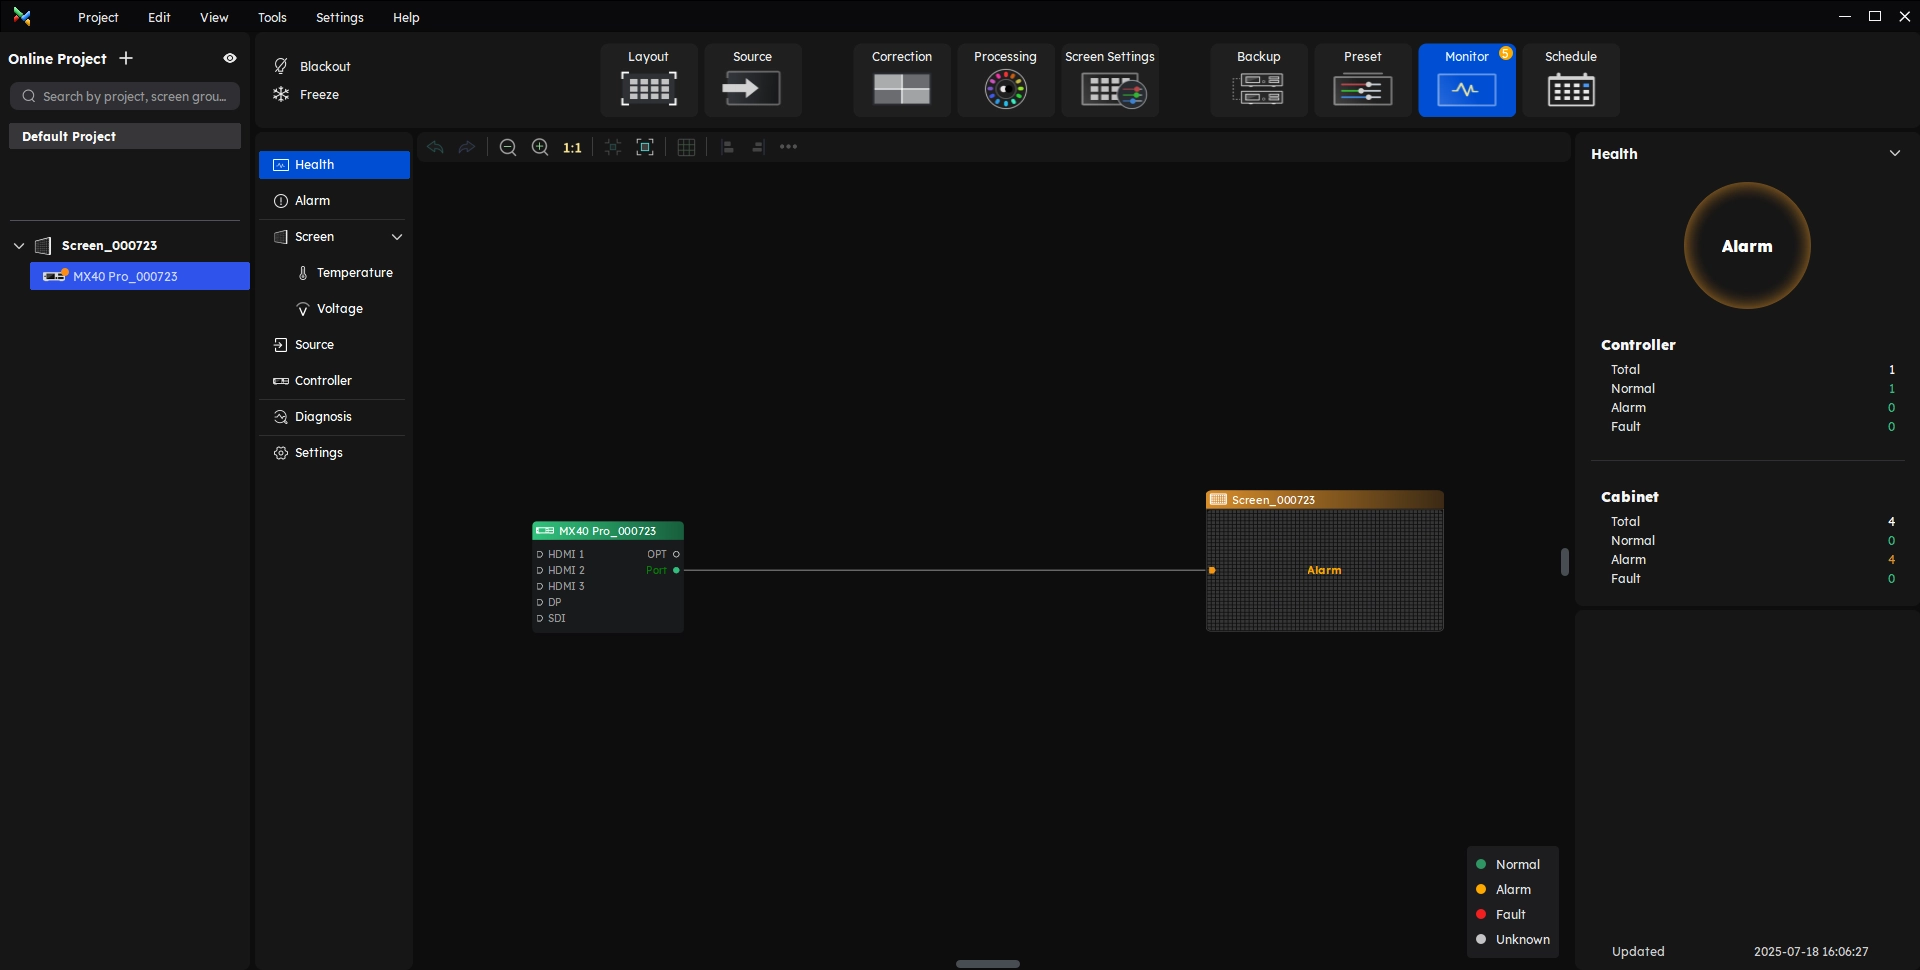
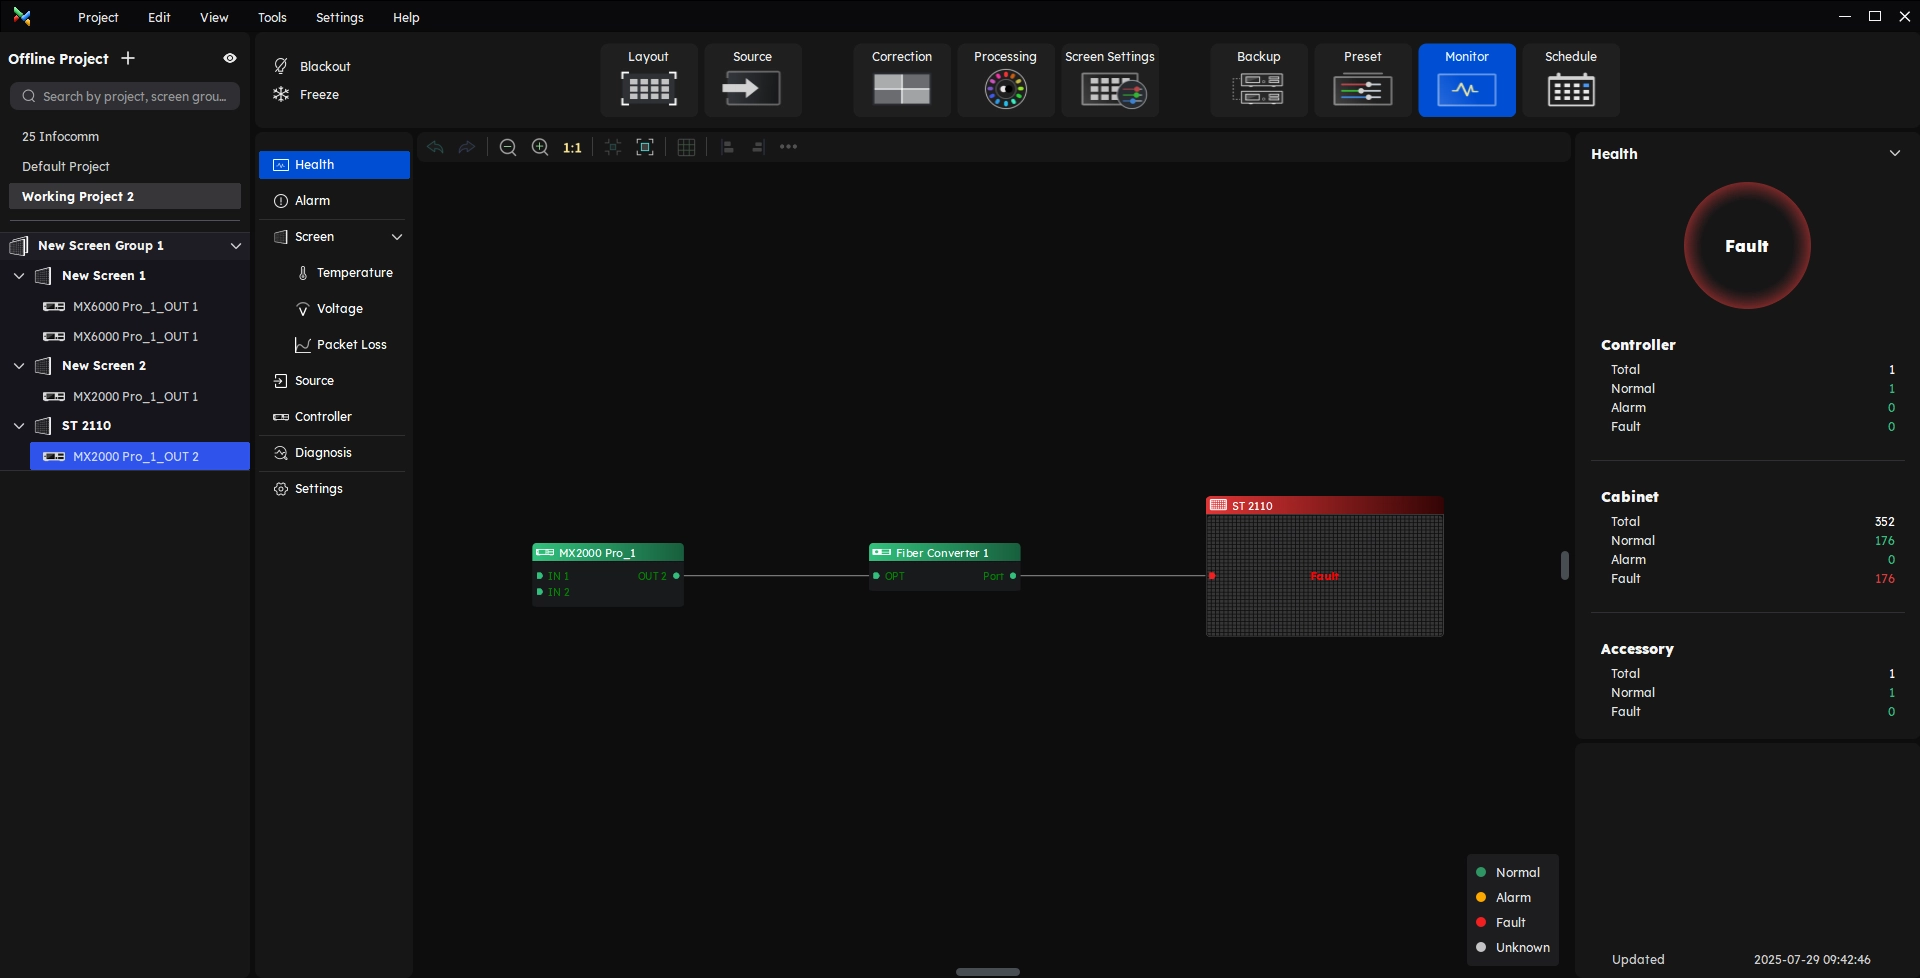
VMP version 1.5.0's new monitor function supports full system health monitoring, which has three statuses:
- Green - the device is running normally,
- Yellow - the device is operating with potential risks.
- Red - the device is experiencing errors.
After entering the monitoring interface through the function tabs, you can view the status of devices in the whole structure from the controller to the receiving card on the screen, which includes multiple types of devices.
The enhanced monitoring functionality now supports Full System Health Monitoring and automatically applies status classification, enabling users to access system operational status in a more streamlined and visual manner.
¶ Alarms Information
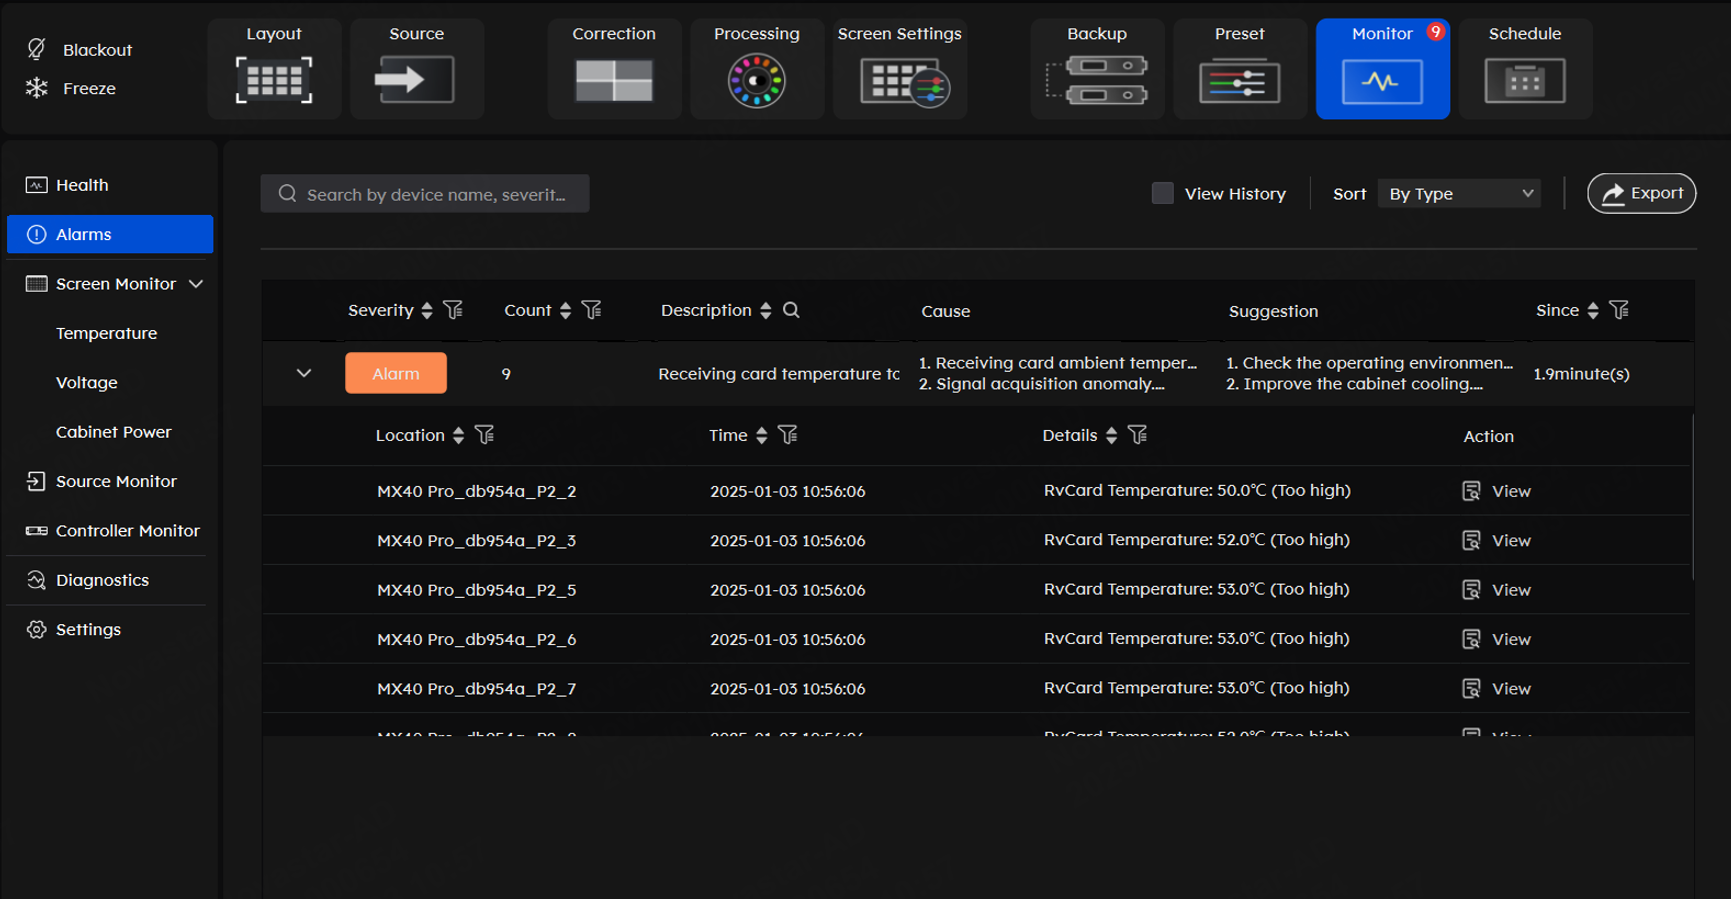
On the alarm interface, you can view all alarm details. The filter function at the top helps users efficiently identify and troubleshoot device issues. At the same time, this interface also provides possible causes and corresponding solutions, in order to help users better solve the problems.
¶ Parameter Monitoring
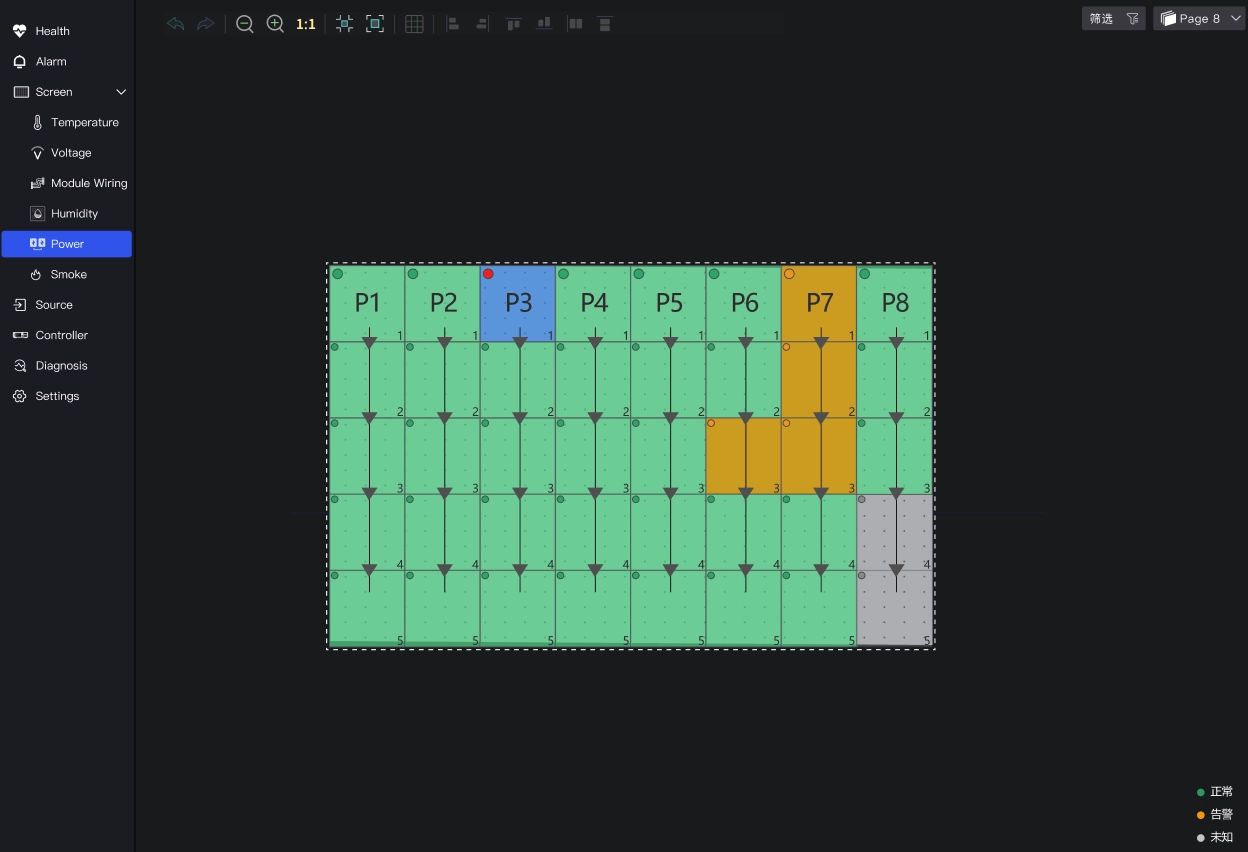
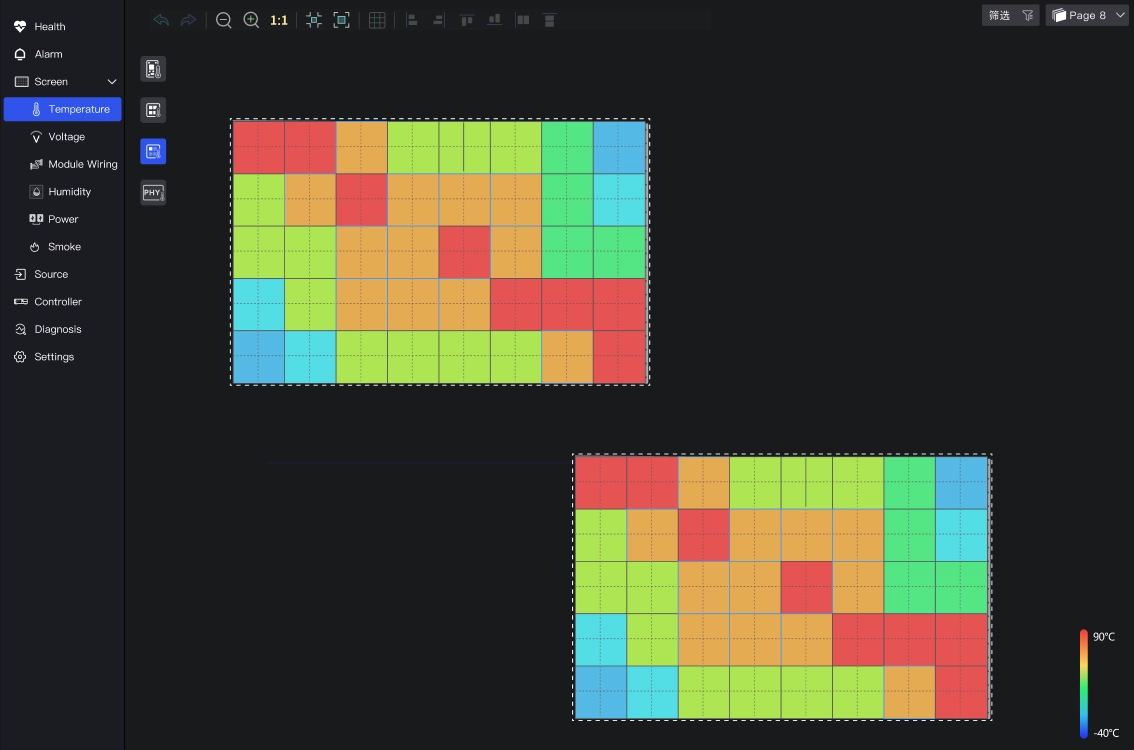
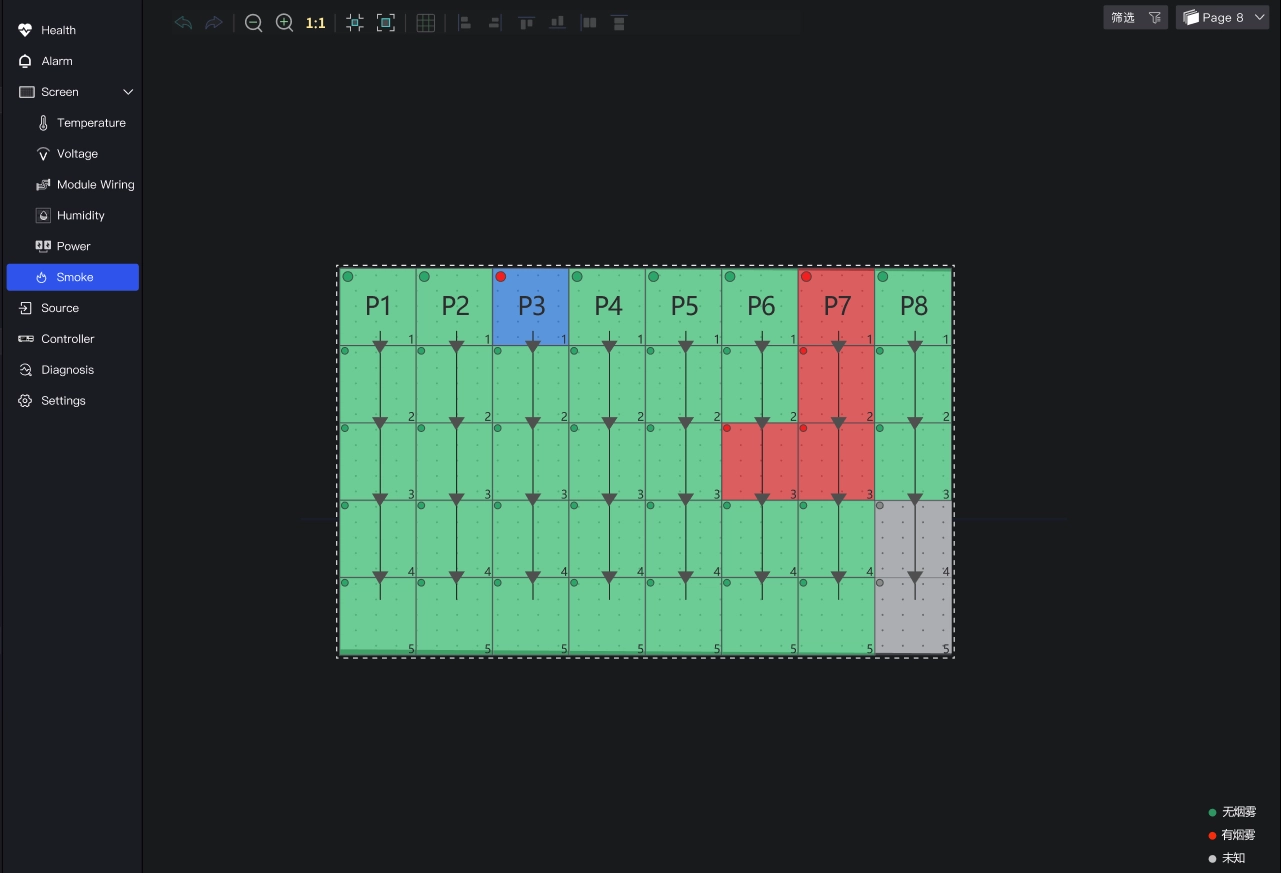
In the latest Version 1.5.0, when paired with specific cabinets, you can now monitor new parameters such as: cabinet temperature, module temperature, receiving card PHY temperature, module voltage, module flat cable, cabinet humidity, cabinet power, cabinet smoke, and input source monitoring, etc..

¶ Cabinet Power Supply (Dual power supplies)
¶ Cabinet Temperature (HUB)
¶ Cabinet Smoke (HUB)
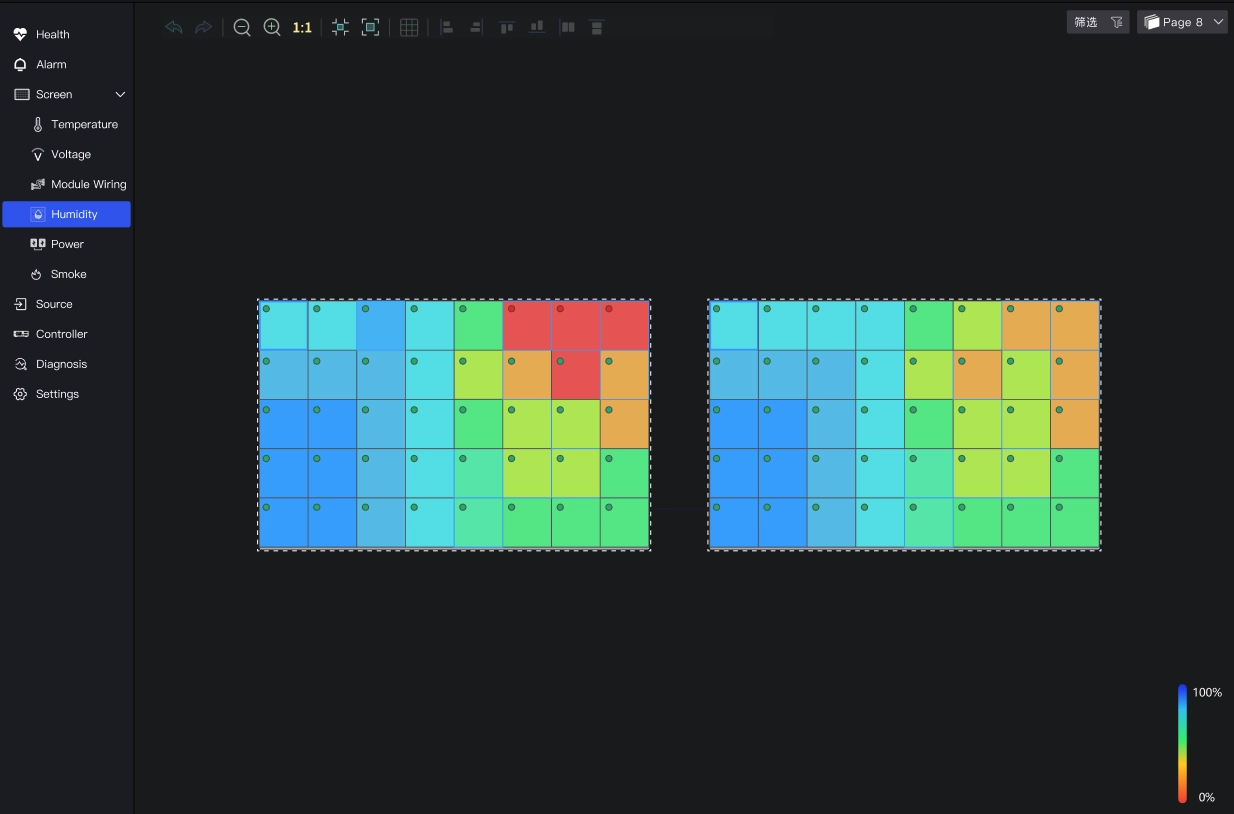
¶ Cabinet Humidity (HUB)
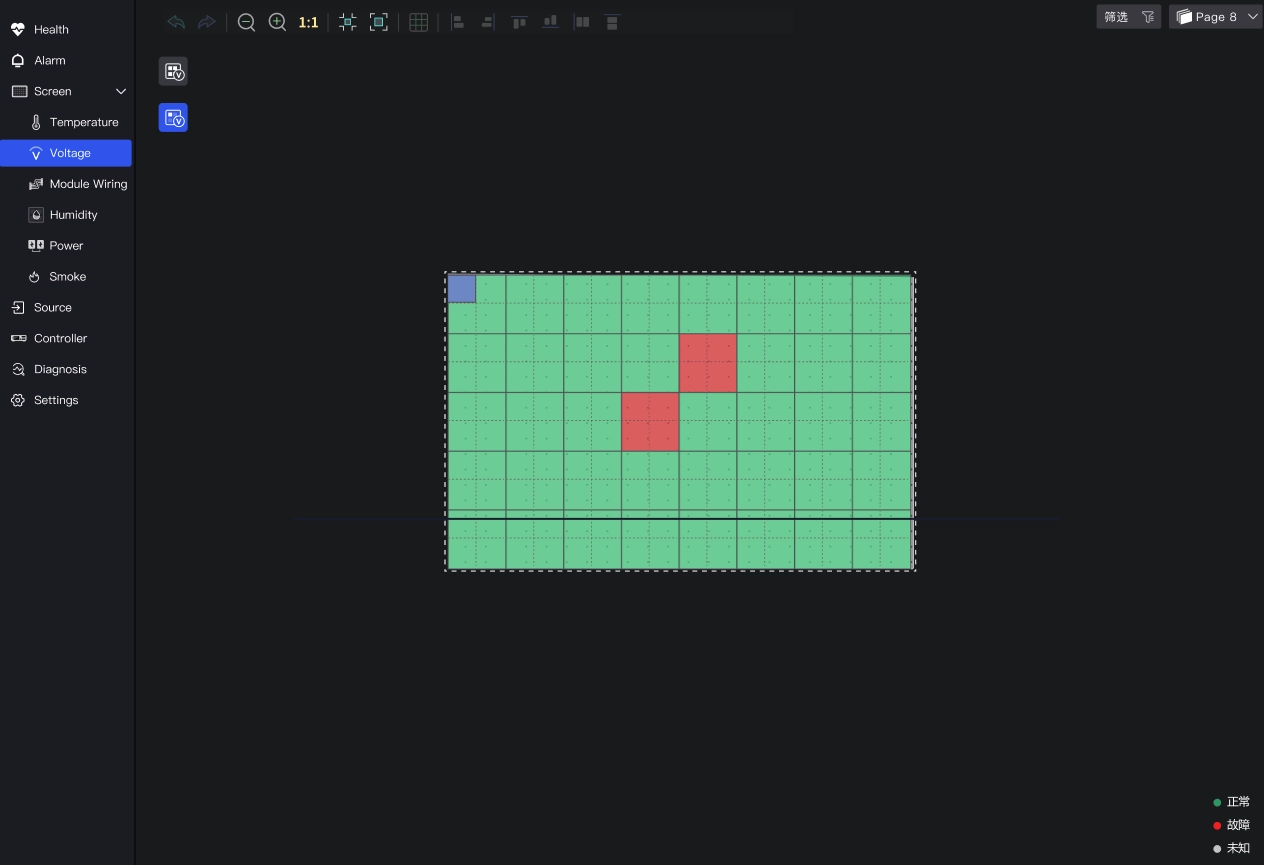
¶ Module Voltage
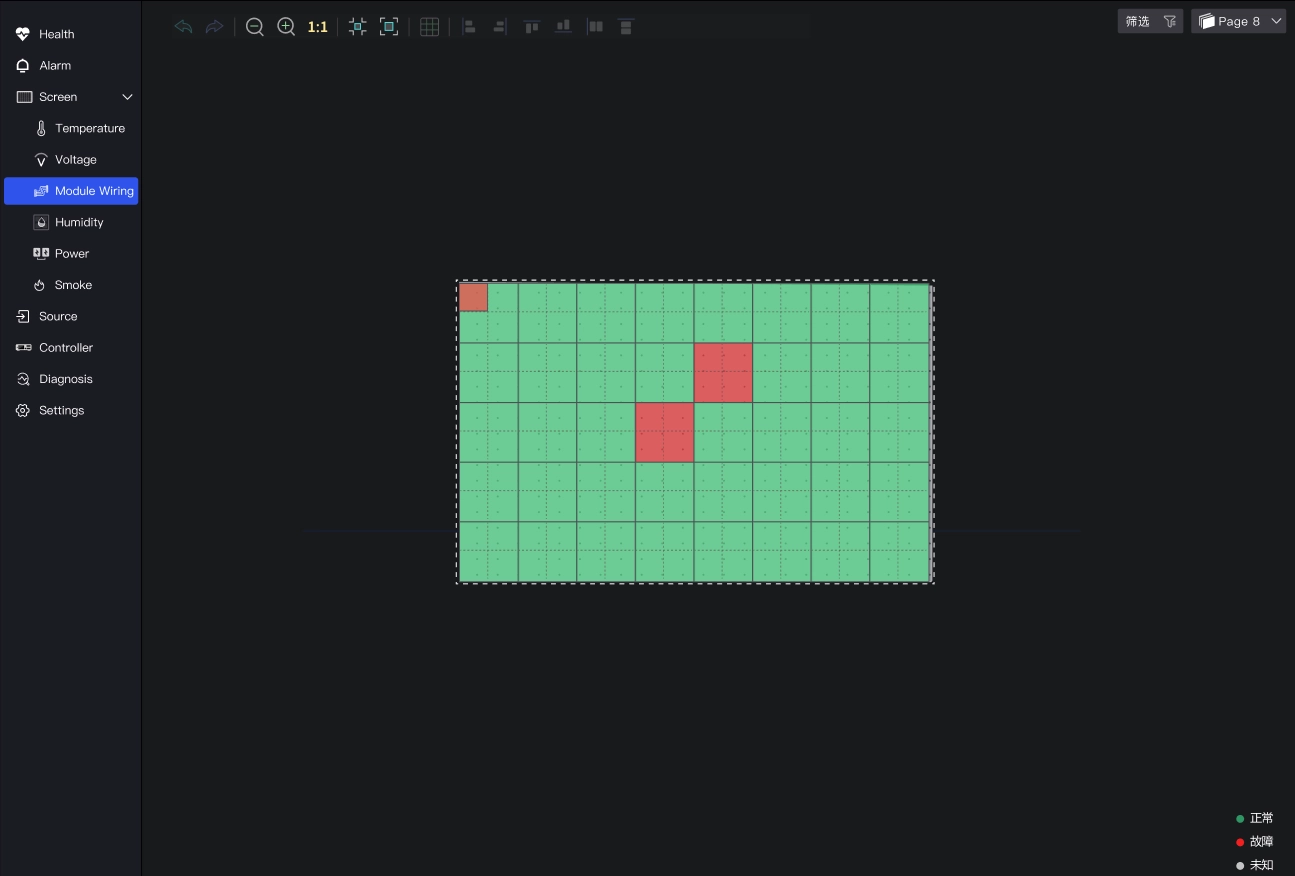
¶ Module Flat Cable
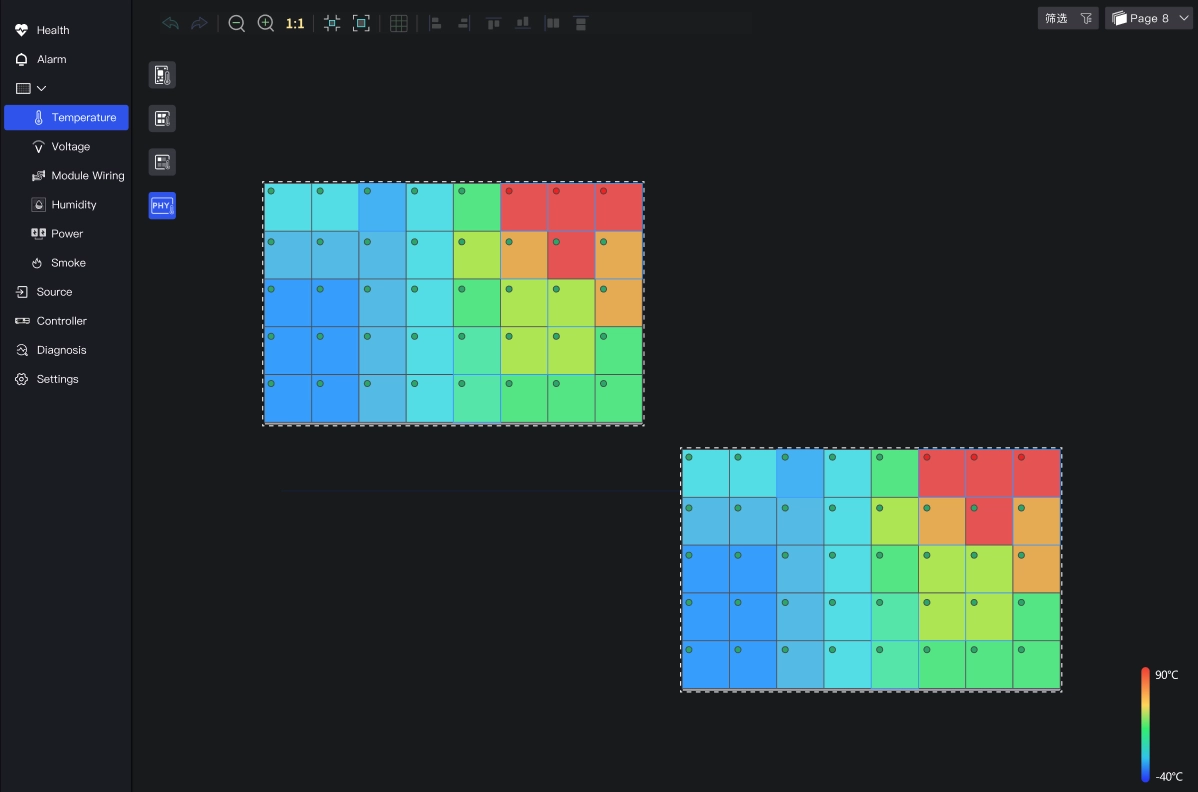
¶ Module Temperature
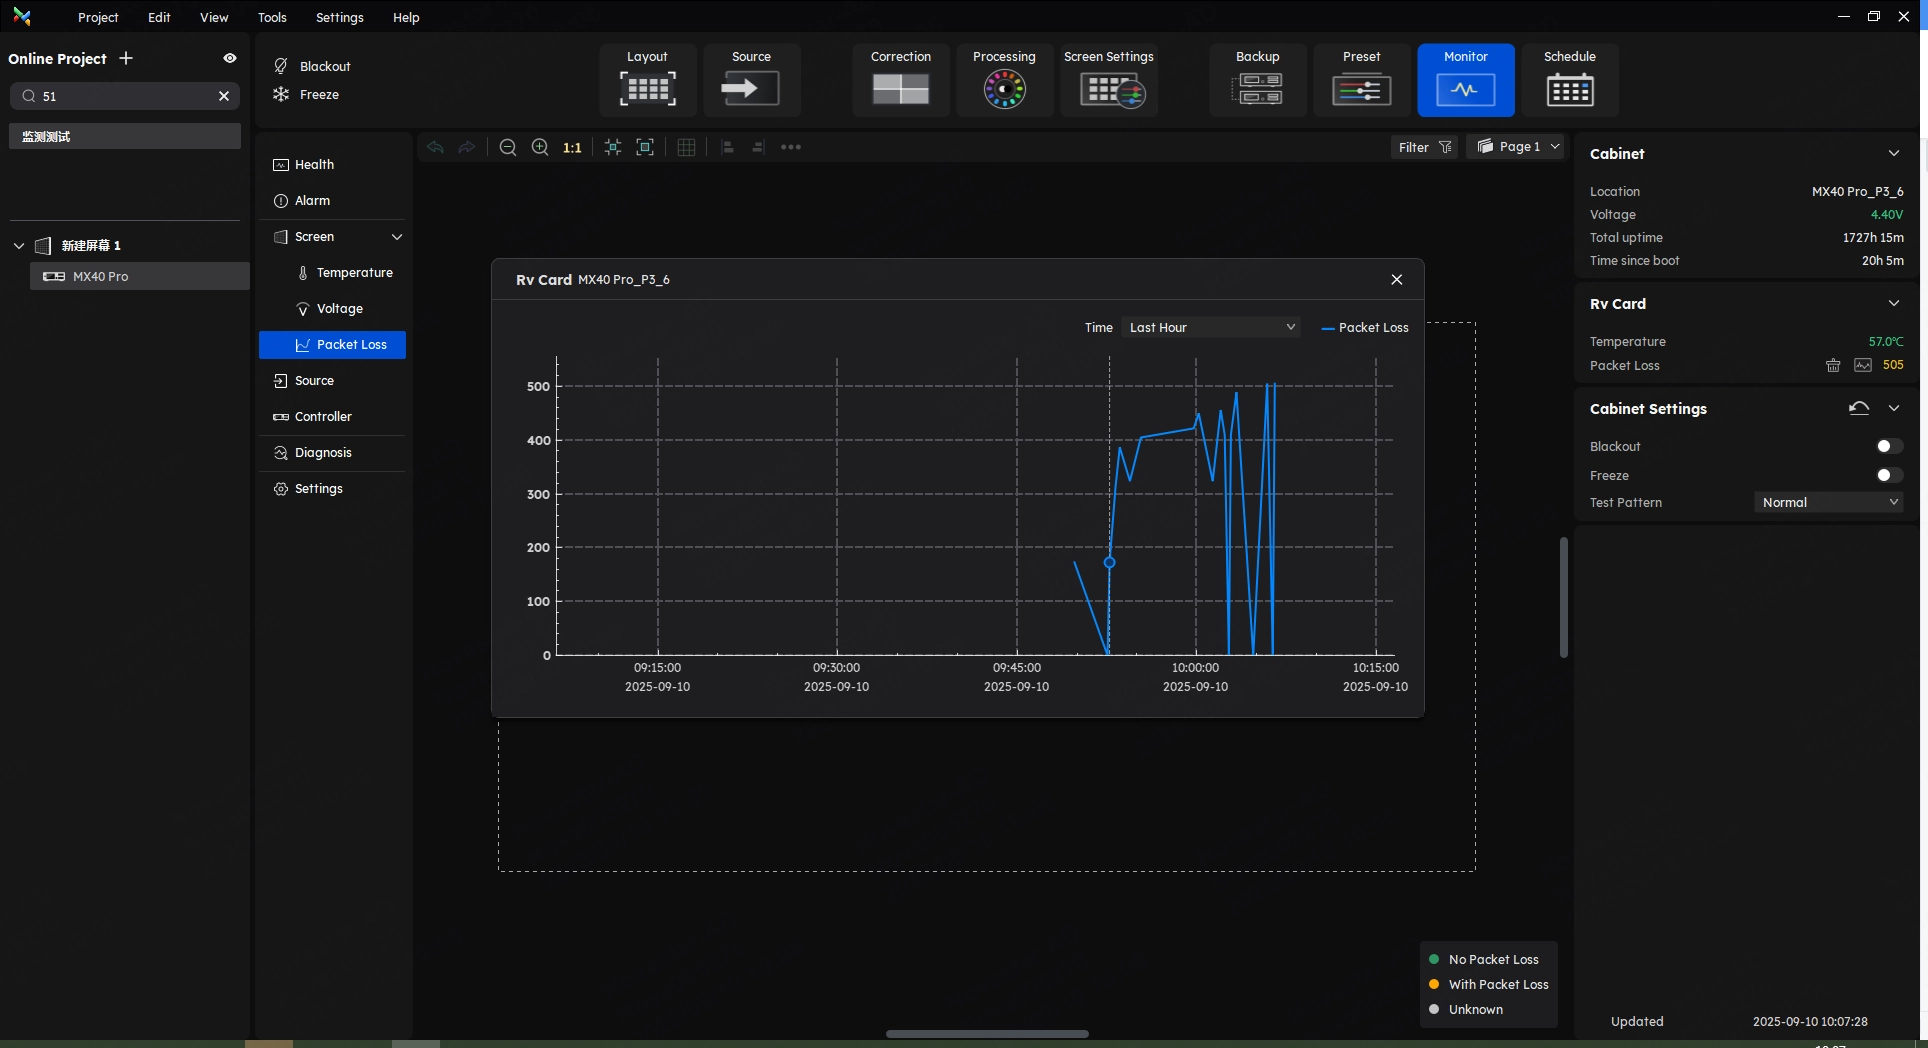
¶ Packet Loss
¶ Source Monitor
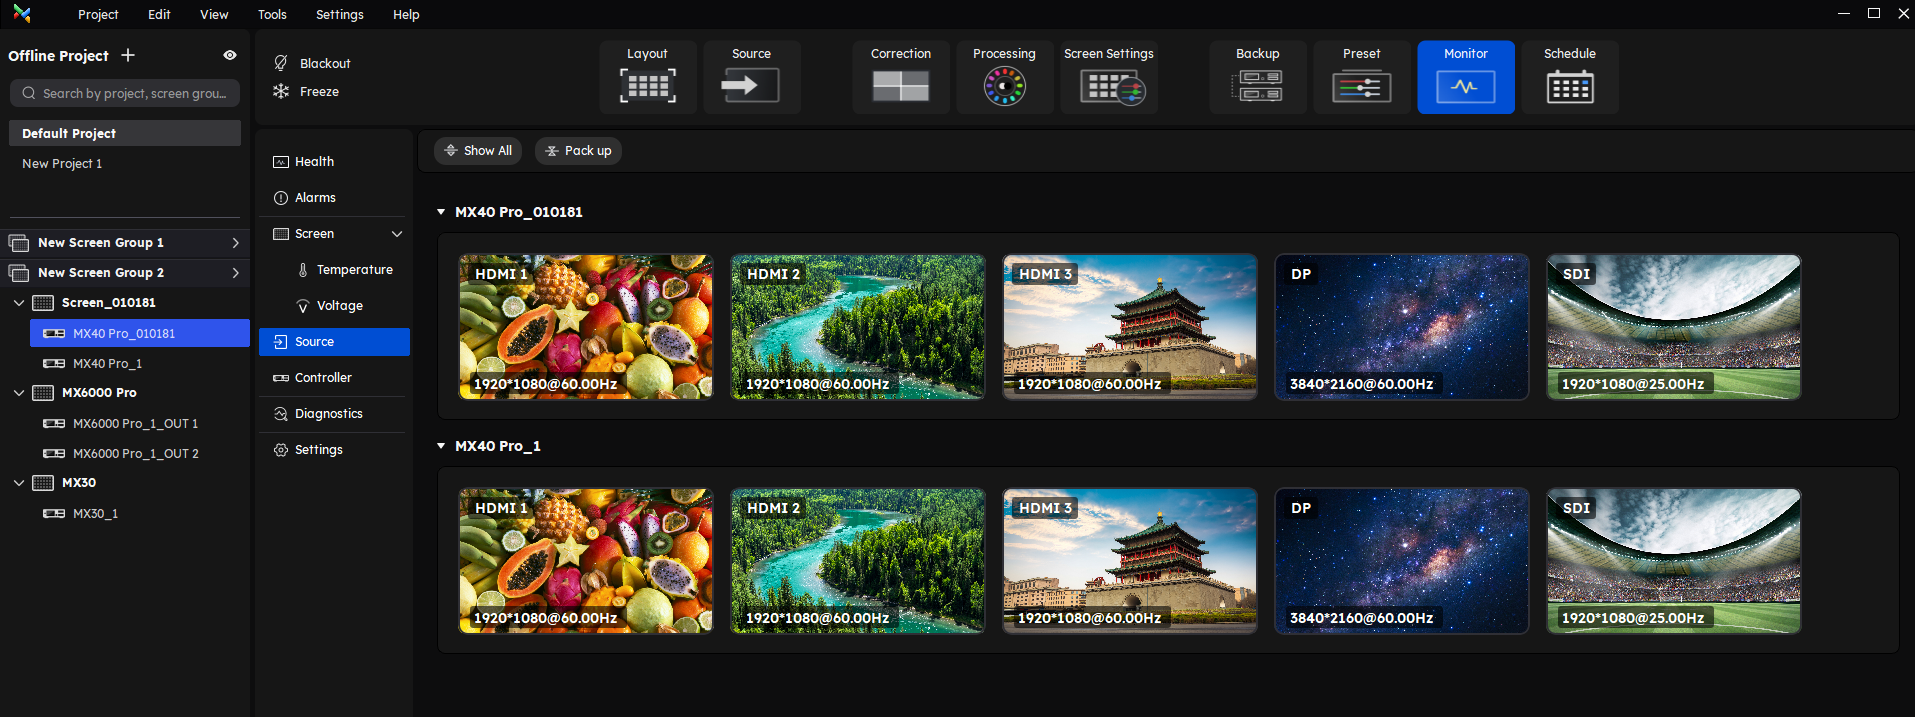
VMP now integrates input source monitoring capabilities. The monitoring interface provides real-time visualization of all input sources connected to the controller, ensuring end-to-end signal traceability.
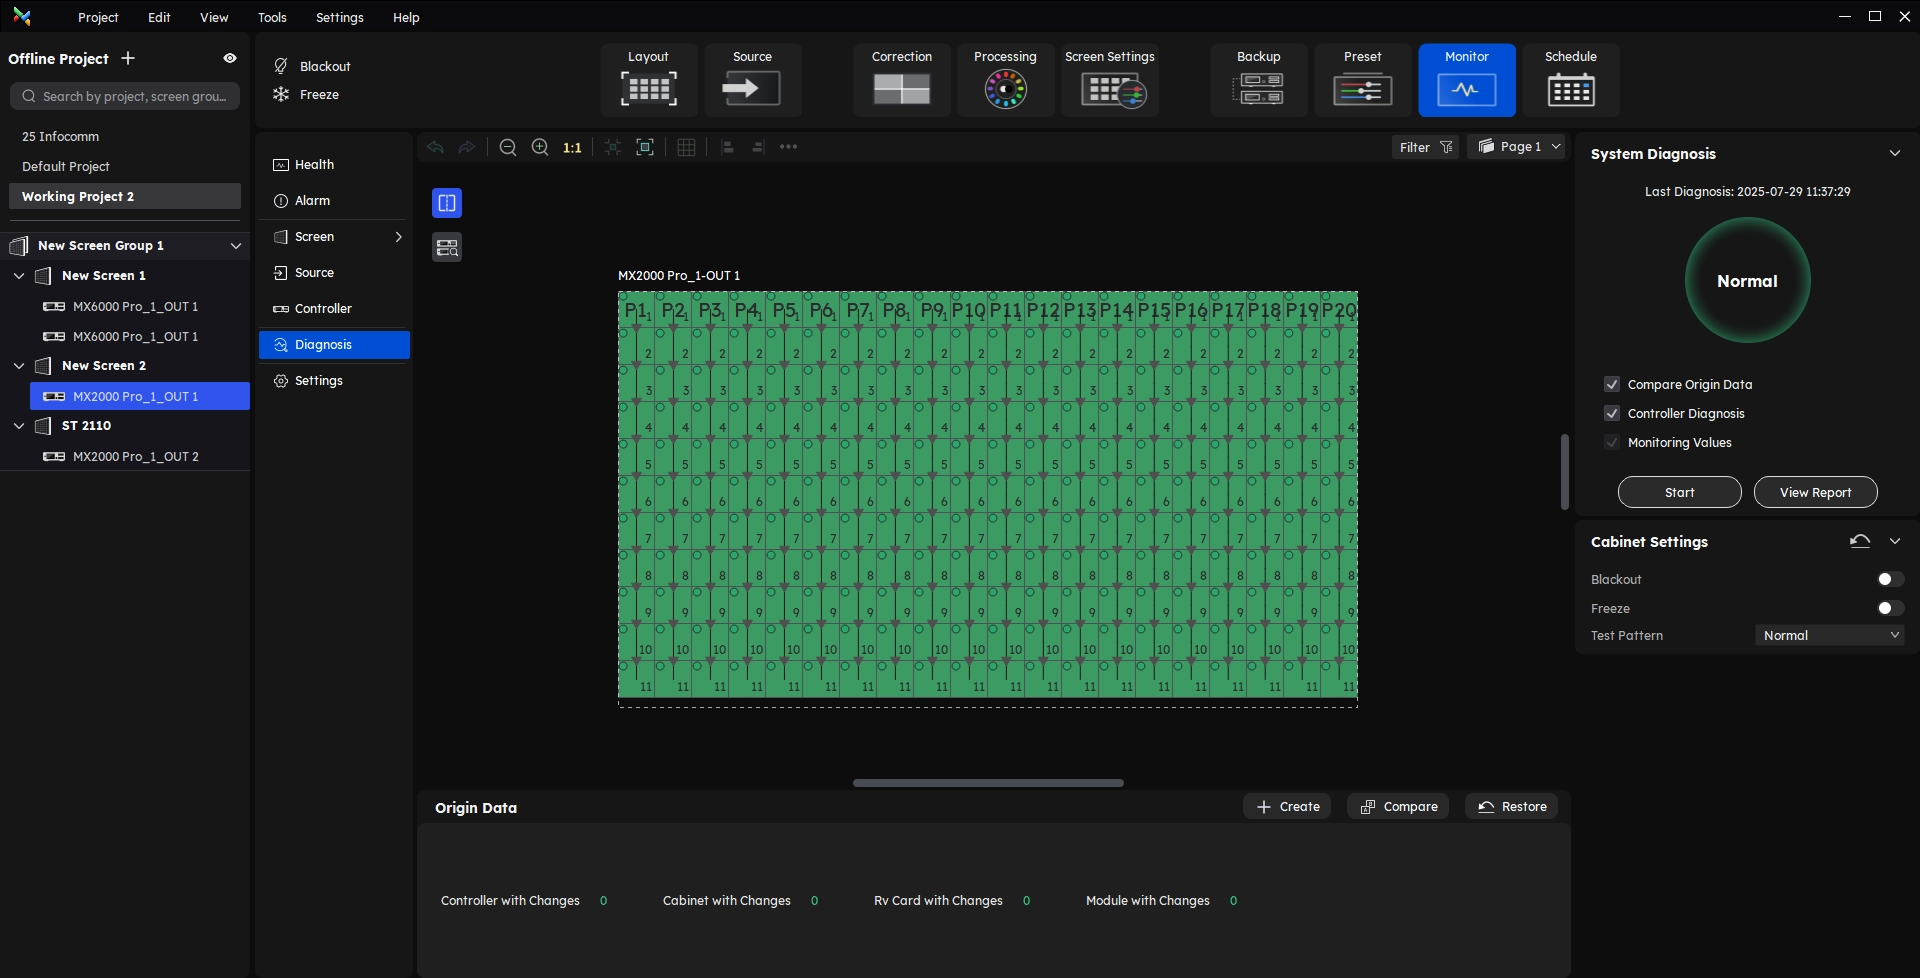
¶ Diagnostics and Origin Data
Diagnostics:
After entering the monitor interface, click Diagnostics on the left side to enter the diagnosis interface.
Users can configure diagnostic tasks, including device diagnostics and monitoring parameters. Diagnostic reports can be previewed or exported.
Besides, users can set the diagnostics plan on the schedule interface to realize the periodic automatic diagnostics.
Origin Data:
After the project configuration is completed, the user can collect the origin data. When something goes wrong, the user can compare the origin data for troubleshooting.
¶ Diagnostic
The VMP now supports automated or manual diagnostics of system states—including controllers and monitoring values—generating comprehensive diagnostic reports. These reports can be independently exported and emailed to streamline project troubleshooting.
¶ Origin Data
The Origin Data Monitoring feature addresses a critical yet frequent scenario. Users can now snapshot and save the control system’s configuration as baseline origin data, and perform one-click comparisons during troubleshooting. This innovation aims to minimize abnormal screen display caused by unauthorized or inadvertent parameter modifications.
¶ Settings
On the monitor interface, click Settings in the left part to find the settings of Monitor and Notification Strategy.
VMP version 1.5.0 supports temperature-based brightness adjustment strategies and screen status notifications.
customize your email reporting strategies in the Monitoring Settings—set notification frequencies on demand to receive comprehensive monitoring reports directly in your designated inbox, enabling 24/7 remote oversight.
We consistently enhance and refine the content of our Wiki articles.
If you find any mistakes or errors, please contact us.
Your continuous feedback and support will help us further improve our products and content.